gnuplot笔记下半部分。
[TOC]
gnuplot命令
1. terminal
gnuplot可以将画出的结果输出到不同terminal中。所谓terminal,既可以是png、eps等图片格式,也可以是x11、qt等窗口格式。
-
x11 支持像素大小
set terminal x11 enhanced lw 3.0 dashlength 5.0 size 1080,755可以使用interactive脚本
set terminal x11 font "Helvetica,45"加上font后,就不能使用了 -
eps 不支持支持像素大小
eps默认是以inch为单位,默认大小是10,6;我的图因为还要放大1.8倍,所以是18,10.8
All PostScript printers or viewers should know about the standard set of Adobe fonts Times-Roman, Helvetica, Courier, and Symbol. -
eps ps、eps格式不支持transparent,png支持
-
eps不支持transparent
ps、eps格式不支持transparent,可以用png格式。
2. 数据筛选/处理
2.1. awk等预处理
- 下面两条命令是等价的
plot 't1.dat'
p '< cat t1.dat' - 我用过
p "<awk '{if(NR>13) print}' q.log"
2.2. pi(pointinterval) for linespoints plot
只用于linespoints plot。决定点的symbol的稀疏,用法例子:pi 2,“means that point symbols are drawn only for every Nth point”
2.3. every
注意every不能简写成e
5个冒号,最后一个数字之后的冒号必须要省略
正确写法是:
p 'PS500_26w_1/msd-PS_1.dat'every 10::::90000 w l
而不是:
p 'PS500_26w_1/msd-PS_1.dat'every 10::::90000: w l
意思是每10个数据点画一个,一共画到第九万个点
具体参看gnuplot5.0.1 P85或help every
2.4. index( column(-2) )
用于一个文件中多块数据stackoverflow
"p = 0.1"
1 1
3 3
4 1"p = 0.2"
1 3
2 2
5 2
|
|
需要注意的是光用空格来分割两个data block是不够的。
column(-2)是Pseudocolumns,可以在manual中搜索是Pseudocolumns。
3. 保存交互模式下的命令为脚本
|
|
4. 函数及设置定义域
|
|
f(x,min,max)=( (x>min && x<max) ? (3*x**2) : 1/0 )的解释:
min,max只是自定义的变量,? :是经典三元表达式,1/0在gnuplot中不会被画出。综合起来f(x,min,max)的定义相当于:如果(x>min && x<max),就画出3*x**2,否则不画。
这里用到的几个技巧很有用,不光可以用来定义域。
5. 自带函数
- log() & log10()
- exp
- sin()等三角函数
- gamma()
6. fit
- 自变量要设定成x、y等,如
f(x)=exp(-(x/tau)**beta),因为gnuplot似乎对变量名敏感 - fit范围 12f(x)=a*x**bfit [0:300] f(x) 'msd.dat'u 1:5 via a,b
7. 传入参数到脚本
命令行(CLI)下,
|
|
“script.plt” 就是ARG0,以此类推"hehestr1"就是ARG1…
8. how to set the config file?
show loadpath will show where the configuration file locate at
gerenal configuration is in app-defaults dir.
e.g., write set loadpath 'your_path' into .gnuplotrc will avoid every time work.
9. smooth csplines 可以解决由于点多画不出虚线的问题
少用的命令
-
parametric mode
1234set parametricset trange [-pi:pi]plot sin(t),cos(t)unset parametric -
MOUSE_BUTTON
点左键 MOUSE_BUTTON==1;
中键 ==2;
右键 ==3;
光点击的话,其他三个自带变量(MOUSE_SHIFT,MOUSE_ALT,MOUSE_CTRL)==0
显示信息型命令
1. show
show variables
show all
2. history
history 5 #显示最近5条命令
history ?load #显示所有以load开头的命令
history ?"set label" #显示所有以set label开头的命令
history !"set label" #执行所有以set label开头的命令
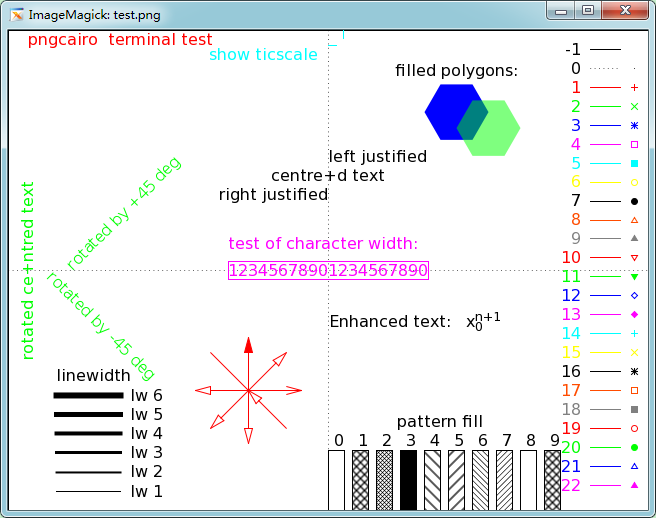
3. test
test可以展示当前terminal或palette的画图效果
test (terminal | palette)
|
|
- x11 test
test x11

- eps test

- png test
各种plot
multiplot
|
|
-
对齐subfig
用set lmargin 进行对齐 -
调整所有subfig的scale大小
set tics scale 3 -
取消前面的设置
因为后面的subfig会继承前面subfig的设置,有时候需要取消前面的设置。
时常需要取消的有:label, arrow, scale等。
最常用的取消方式是unset
对于key–set key default
对于tics– set xtics autofreq
3D plot
-
view
view用来设定3d图的观察角度
set view <rot_x>, <rot_z>
默认值是:
set view 60, 30 -
设置Z轴起点
set xyplane at 0.6 -
设置背景网格
set grid x y z back -
自定义渐变色
set palette define (0.6 "#FF0000",1.1 "blue") -
External Link
using gnuplot
Plot functions using the special-filenames property
- colorbox
自定义colorbox:set colorbox vertical user origin 1.1,0.5 size .06,.4
设定colorbox的tics:set cbtics 0.1
set logscale cb
set cbrange [0.001:1]
filled curve

plot 'silver.dat' u 1:2:3 w filledcu
time series
To plot data in time series, you need several special sets.
From manual5.1
Xtics timedata
In case of timeseries data, axis tic position values must be given as quoted dates or times according to the
formattimefmt. If the, , form is used, and must be given according
to timefmt, butmust be in seconds. Times will be written out according to the format given on
set format, however.
Example:
|
|

User-defined function
-
auto name
12345# convert incoming parameter "ARG1" to eps name automatically.# e.g., if "ARG1" is "price.plt", then automatic name is "price.eps"name_length=strlen(ARG1)-4name=ARG1[:name_length]set output name.".eps" -
save as eps with specific format
1234set size 1.8,1.8set termoption dashset terminal postscript eps enhanced color lw 4.0 dashlength 8.0 "Helvetica,45"call "auto-eps-name.gnu" ARG1
Add call "size1.8-font45-lw4-eps.gnu" ARG0 to your gnuplot script and that’s it!
Error & 问题:
- 输出文件的大小为0——解决方法:
The eps file doesn’t get written until a plot command is specified after specifing the output. Possible solutions:
- Move your plot command after your set output command
- add a replot command to the end of your script
Reference
An amazing web: gnuplotting.org